Generate boxplots of TMB distribution versus clinical response
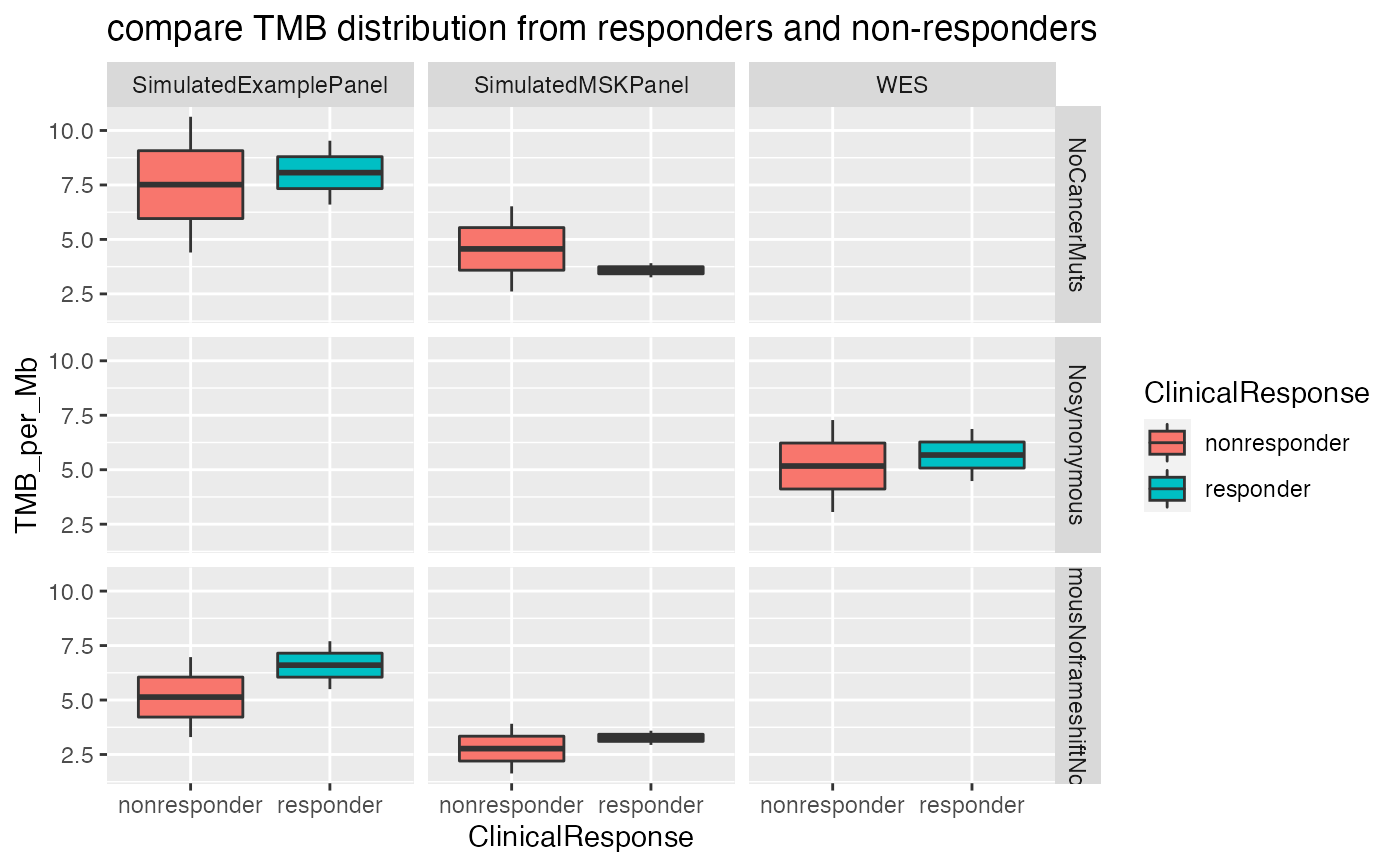
generateBoxplot.RdThis function generates boxplots representing the distribution of TMB values between immunotherapy responders and nonresponders.
generateBoxplot(TMB_clinical)
Arguments
| TMB_clinical | dataframe generated by annotateTMB() |
|---|
Value
boxplot
Examples
#' # Import datasets
data(TMB_VanAllen)
data("VanAllen_Clinical")
# Annotate TMB with clinical reponse
TMB_clincal_response <- annotateTMB(TMB_df = TMB_VanAllen, ClinicalData = VanAllen_Clinical )

# generate plot
generateBoxplot(TMB_clincal_response)